
A community-level look at TRREB’s July 2026 numbers, with pricing by home type across all three towns.
The Big Picture Across the GTA
Greater Toronto Area resale conditions tightened again in July, and that tightening is the theme worth watching heading into the fall market. GTA REALTORS® reported 5,995 home sales through TRREB’s MLS® System — down just 0.9% from a year earlier — while new listings fell a much steeper 17.8% year-over-year. That gap between sales holding roughly flat and new supply pulling back sharply is what’s behind the shift in negotiating leverage this summer.

The MLS® Home Price Index Composite benchmark was down 4.6% year-over-year, tracking closely with the drop in average selling price. On a seasonally adjusted, month-over-month basis, though, sales actually ticked up in July while new listings pulled back further — a sign the market kept tightening through the summer rather than cooling off. TRREB’s Chief Information Officer noted that recent economic data has come in stronger than expected, which could help bring more confidence — and more buyers — off the sidelines this fall if prices stabilize.
Average Selling Price: GTA vs. the Three Local Markets
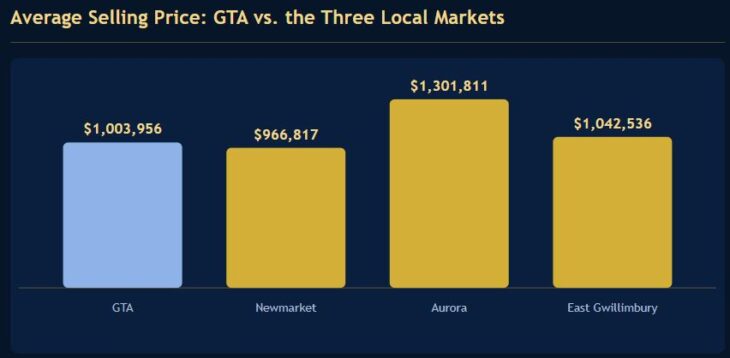
Aurora and East Gwillimbury both sold above the GTA-wide average in July, reflecting their larger share of detached and estate-style homes. Newmarket, with a more varied housing stock, came in just under the GTA average.
Community Breakdown
Here’s how each of the three local markets performed in July 2026:
Newmarket
| Category | July 2026 |
|---|---|
| Home sales | 82 |
| New listings | 194 |
| Active listings | 331 |
| Average selling price | $966,817 |
| MLS® HPI benchmark price | $1,008,500 (▼ 6.3% YoY) |
| Sales-to-new-listings ratio | 37.5% |
| Months of inventory | 4.2 |
| Avg. sale-to-list price ratio | 98% |
| Avg. days on market | 27 (listing) / 45 (property) |
Newmarket posted the busiest month of the three towns and the tightest sales-to-new-listings ratio, with homes selling in the fewest days and averaging 98 cents on every listed dollar — a sign well-priced homes are still moving quickly here even as prices sit below year-ago levels.
Aurora
| Category | July 2026 |
|---|---|
| Home sales | 62 |
| New listings | 163 |
| Active listings | 301 |
| Average selling price | $1,301,811 |
| Median selling price | $1,175,000 |
| MLS® HPI benchmark price | $1,138,900 (▼ 4.6% YoY) |
| Sales-to-new-listings ratio | 35.3% |
| Months of inventory | 4.9 |
| Avg. sale-to-list price ratio | 95% |
| Avg. days on market | 34 (listing) / 57 (property) |
Aurora carried the highest average price of the three towns by a wide margin, driven largely by detached and estate homes, and had the smallest gap between benchmark price decline and average price decline — suggesting the mix of homes sold stayed fairly consistent with a year ago.
East Gwillimbury
| Segment | July 2026 |
|---|---|
| Home sales | 47 |
| New listings | 106 |
| Active listings | 194 |
| Average selling price | $1,042,536 |
| Median selling price | $1,050,000 |
| MLS® HPI benchmark price | $1,119,300 (▼ 7.7% YoY) |
| Sales-to-new-listings ratio | 33.4% |
| Months of inventory | 5.3 |
| Avg. sale-to-list price ratio | 97% |
| Avg. days on market | 33 (listing) / 43 (property) |
East Gwillimbury saw the steepest year-over-year price pullback of the three towns and carried the most months of inventory, giving buyers here comparatively more room to negotiate than in Newmarket or Aurora.
Prices by Home Type
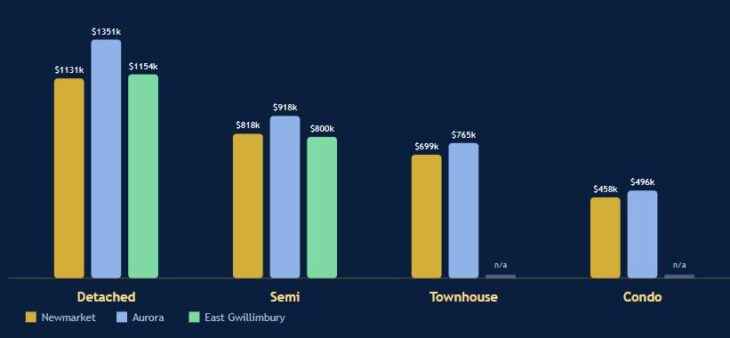
Breaking each market down by housing segment tells a more useful story than the town-wide average alone, since the mix of detached homes, semis, townhouses and condos sold each month can swing the headline number. These are the MLS® HPI benchmark prices — a measure of a “typical” home in each category — for July 2026:
| Segment | Newmarket | Aurora | East Gwillimbury |
|---|---|---|---|
| Detached | $1,131,100 (-5.5%) | $1,351,000 (-3.7%) | $1,153,800 (-7.7%) |
| Semi-detached | $817,500 (-5.5%) | $918,400 (-6.2%) | $799,900 (-8.4%) |
| Townhouse | $699,200 (-4.9%) | $765,300 (-6.6%) | insufficient sales |
| Condo apartment | $457,500 (-11.3%) | $496,000 (-12.3%) | insufficient sales |
What This Means If You’re Buying or Selling
For buyers: Condo apartments across all three towns are down double digits year-over-year, the steepest pullback of any segment — worth a look if a smaller footprint fits your needs. Detached and semi-detached homes have held their value better, especially in Aurora, so don’t expect much room to negotiate on a well-priced, move-in-ready detached listing.
For sellers: Newmarket’s 98% sale-to-list ratio and 27-day average time on market show that accurately priced homes are still selling briskly. Active listings are up and new supply is tightening across the region, so the homes standing out are the ones priced to today’s market from day one rather than tested at last year’s numbers.
For everyone: With the Bank of Canada expected to hold rates through the balance of 2026 and inventory continuing to tighten, the second half of the year could bring more stable pricing across York Region — particularly if consumer confidence keeps improving as TRREB’s economists have suggested.
Check our previous posts: